jvm原理(41)jmap_jstat_jcmd_jmc_jhat讲解与实战

jmap

jmap命令的doc如下:

1
2
3
4
5
6
7
8
9
10
11
12
13
14
15
16
17
18
19
20
21
22
23
24
25
26
27
28
29
C:\Users\Administrator>jmap
Usage:
jmap [option] <pid>
(to connect to running process)
jmap [option] <executable <core>
(to connect to a core file)
jmap [option] [server_id@]<remote server IP or hostname>
(to connect to remote debug server)

where <option> is one of:
<none> to print same info as Solaris pmap
-heap to print java heap summary
-histo[:live] to print histogram of java object heap; if the "live"
suboption is specified, only count live objects
-clstats to print class loader statistics
-finalizerinfo to print information on objects awaiting finalization
-dump:<dump-options> to dump java heap in hprof binary format
dump-options:
live dump only live objects; if not specified,
all objects in the heap are dumped.
format=b binary format
file=<file> dump heap to <file>
Example: jmap -dump:live,format=b,file=heap.bin <pid>
-F force. Use with -dump:<dump-options> <pid> or -histo
to force a heap dump or histogram when <pid> does not
respond. The "live" suboption is not supported
in this mode.
-h | -help to print this help message
-J<flag> to pass <flag> directly to the runtime system

jmap -clstats PID

jmap -clstats PID :打印类加载器的数据。
现在我们写一个死循环的程序,然后用jmap测试一下:

1
2
3
4
5
6
7
public class MyTest5 {
public static void main(String[] args) {
for (;;){
System.out.println("hello world");
}
}
}

用jmap查询类加载器的情况:

1
2
3
4
5
6
7
8
9
10
11
12
13
14
15
16
17
18
19
20
21
22
23
C:\Users\Administrator>jps
16064 Jps
19216
9524 Launcher
4184 RemoteMavenServer
4536 Launcher
6444 MyTest5

C:\Users\Administrator>jmap -clstats 6444
Attaching to process ID 6444, please wait...
Debugger attached successfully.
Server compiler detected.
JVM version is 25.111-b14
finding class loader instances ..done.
computing per loader stat ..done.
please wait.. computing liveness...liveness analysis may be inaccurate ...
class_loader classes bytes parent_loader alive? type

<bootstrap> 567 1071357 null live <internal>
0x00000006c140a808 24 71712 0x00000006c140a878 live sun/misc/Launcher$AppClassLoader@0x00000007c000f6a0
0x00000006c140a878 0 0 null live sun/misc/Launcher$ExtClassLoader@0x00000007c000fa48

total = 3 591 1143069 N/A alive=3, dead=0 N/A

jstat -gcutil pid 3000

用来查看当前线程的young gc、full gc的频率
参数3000是多少时间刷新一次

jmap -histo:live pid

查看当前线程持有的对象及其数量。

jmap -heap

打印当前进程堆的情况:

1
2
3
4
5
6
7
8
9
10
11
12
13
14
15
16
17
18
19
20
21
22
23
24
25
26
27
28
29
30
31
32
33
34
35
36
37
38
39
40
41
42
43
44
45
46
47
C:\Users\Administrator>jmap -heap 6444
Attaching to process ID 6444, please wait...
Debugger attached successfully.
Server compiler detected.
JVM version is 25.111-b14

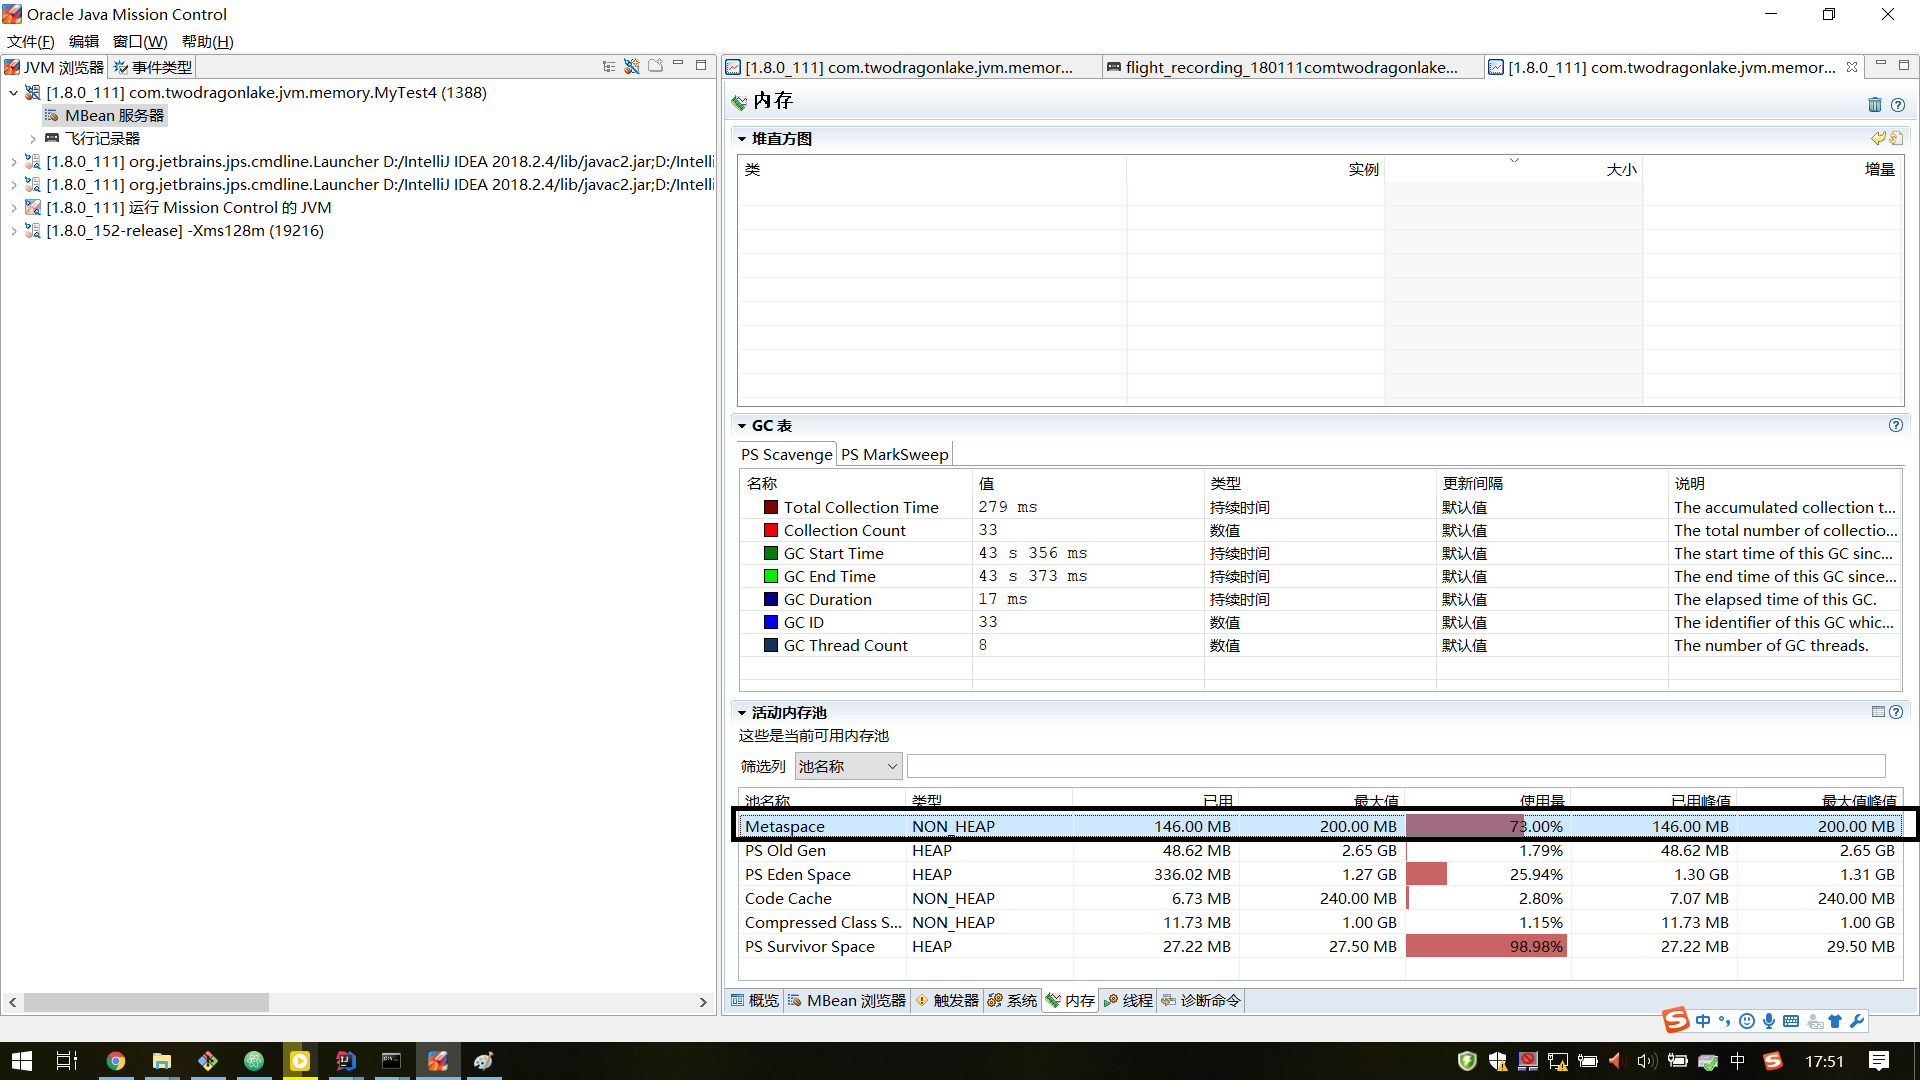
using thread-local object allocation.
Parallel GC with 8 thread(s) 【使用的GC收集器,8个线程】

Heap Configuration:
MinHeapFreeRatio = 0
MaxHeapFreeRatio = 100
MaxHeapSize = 4273995776 (4076.0MB)
NewSize = 89128960 (85.0MB)
MaxNewSize = 1424490496 (1358.5MB)
OldSize = 179306496 (171.0MB)
NewRatio = 2
SurvivorRatio = 8
MetaspaceSize = 21807104 (20.796875MB)
CompressedClassSpaceSize = 1073741824 (1024.0MB)
MaxMetaspaceSize = 17592186044415 MB
G1HeapRegionSize = 0 (0.0MB)

Heap Usage:
PS Young Generation
Eden Space:
capacity = 31981568 (30.5MB)
used = 5756808 (5.490119934082031MB)
free = 26224760 (25.00988006591797MB)
18.000393226498463% used
From Space:
capacity = 524288 (0.5MB)
used = 0 (0.0MB)
free = 524288 (0.5MB)
0.0% used
To Space:
capacity = 524288 (0.5MB)
used = 0 (0.0MB)
free = 524288 (0.5MB)
0.0% used
PS Old Generation
capacity = 179306496 (171.0MB)
used = 798896 (0.7618865966796875MB)
free = 178507600 (170.2381134033203MB)
0.4455477173565424% used

1782 interned Strings occupying 158912 bytes.

jmap -dump

输出当前堆的快照到文件:
jmap -dump:format=b,file=e:dump.hprof 6444
这样会生成当前堆的一个快照,之后用jvisualvm加载快照进行可视化分析。

jstat

命令的doc说明:

1
2
3
4
5
6
7
8
9
10
11
12
13
14
15
16
17
18
19
20
21
22
C:\Users\Administrator>jstat
invalid argument count
Usage: jstat -help|-options
jstat -<option> [-t] [-h<lines>] <vmid> [<interval> [<count>]]

Definitions:
<option> An option reported by the -options option
<vmid> Virtual Machine Identifier. A vmid takes the following form:
<lvmid>[@<hostname>[:<port>]]
Where <lvmid> is the local vm identifier for the target
Java virtual machine, typically a process id; <hostname> is
the name of the host running the target Java virtual machine;
and <port> is the port number for the rmiregistry on the
target host. See the jvmstat documentation for a more complete
description of the Virtual Machine Identifier.
<lines> Number of samples between header lines.
<interval> Sampling interval. The following forms are allowed:
<n>["ms"|"s"]
Where <n> is an integer and the suffix specifies the units as
milliseconds("ms") or seconds("s"). The default units are "ms".
<count> Number of samples to take before terminating.
-J<flag> Pass <flag> directly to the runtime system.

jvmstat -gc

1
2
3
C:\Users\Administrator>jstat -gc 6444
S0C S1C S0U S1U EC EU OC OU MC MU CCSC CCSU YGC YGCT FGC FGCT GCT
512.0 512.0 0.0 0.0 31232.0 14367.0 175104.0 780.2 4864.0 3519.5 512.0 386.2 788 0.479 0 0.000 0.479

MC:分配的元空间的大小。
MU:已经使用的元空间的大小。
因为我们的程序是一个死循环,不会对元空间进行动态增加,现在我们使用上一节的如下程序:

1
2
3
4
5
6
7
8
9
10
11
12
public class MyTest4 {
public static void main(String[] args) {
for(;;){
Enhancer enhancer = new Enhancer();
enhancer.setSuperclass(MyTest4.class);
enhancer.setUseCache(false);
enhancer.setCallback((MethodInterceptor)(obj, method, args1, proxy) -> proxy.invokeSuper(obj,args));
System.out.println("hello world");
enhancer.create();
}
}
}

jstat打印一下:

1
2
3
4
5
6
7
8
9
10
11
12
13
14
15
16
17
18
19
20
21
22
23
24
25
26
27
28
29
30
31
32
33
34
35
36
37
38
C:\Users\Administrator>jps
19216
21892 MyTest4
4740 Main
3320 Jps
4184 RemoteMavenServer
4536 Launcher
17916 Launcher
我们的测试类是MyTest4【pid:21892】,然后我们多次打印,得到如下列表:
C:\Users\Administrator>jstat -gc 21892
S0C S1C S0U S1U EC EU OC OU MC MU CCSC CCSU YGC YGCT FGC FGCT GCT
7168.0 13312.0 6816.0 0.0 1234944.0 1160712.2 219136.0 29834.2 71576.0 71320.5 5800.0 5705.9 18 0.112 3 0.228 0.340

C:\Users\Administrator>jstat -gc 21892
S0C S1C S0U S1U EC EU OC OU MC MU CCSC CCSU YGC YGCT FGC FGCT GCT
14336.0 15872.0 13344.0 0.0 1359360.0 353416.7 219136.0 29834.2 83864.0 83342.1 6824.0 6643.2 20 0.130 3 0.228 0.357

C:\Users\Administrator>jstat -gc 21892
S0C S1C S0U S1U EC EU OC OU MC MU CCSC CCSU YGC YGCT FGC FGCT GCT
15872.0 21504.0 15856.0 0.0 1348096.0 647073.4 219136.0 33642.2 95256.0 94760.5 7720.0 7533.6 22 0.154 3 0.228 0.381

C:\Users\Administrator>jstat -gc 21892
S0C S1C S0U S1U EC EU OC OU MC MU CCSC CCSU YGC YGCT FGC FGCT GCT
23040.0 23040.0 2784.0 0.0 1345024.0 106901.6 321024.0 51215.3 103576.0 103289.6 8360.0 8198.3 24 0.167 4 0.397 0.564

C:\Users\Administrator>jstat -gc 21892
S0C S1C S0U S1U EC EU OC OU MC MU CCSC CCSU YGC YGCT FGC FGCT GCT
22528.0 5632.0 0.0 5472.0 1345024.0 1232187.7 321024.0 51215.3 108312.0 108021.3 8744.0 8567.5 25 0.172 4 0.397 0.568
C:\Users\Administrator>jstat -gc 21892
S0C S1C S0U S1U EC EU OC OU MC MU CCSC CCSU YGC YGCT FGC FGCT GCT
32256.0 33280.0 21856.0 0.0 1324544.0 715254.8 418304.0 86847.4 203544.0 203157.8 16168.0 15985.9 56 0.509 5 0.730 1.239

C:\Users\Administrator>jstat -gc 21892
S0C S1C S0U S1U EC EU OC OU MC MU CCSC CCSU YGC YGCT FGC FGCT GCT
35328.0 35328.0 0.0 64.0 1320448.0 0.0 910848.0 40670.6 204800.0 204569.1 16168.0 16093.9 61 0.532 10 1.586 2.119

C:\Users\Administrator>jstat -gc 21892
21892 not found 【到达200m程序退出】

可以很明显的看到MC和MU在一直增加。
由于MyTest4设置-XX:MaxMetaspaceSize=200m 等程序的MC和MU到达200m的时候程序就会出现溢出而终止。

jps

jps的doc:

1
2
3
4
5
6
C:\Users\Administrator>jps -help
usage: jps [-help]
jps [-q] [-mlvV] [<hostid>]

Definitions:
<hostid>: <hostname>[:<port>]

jsp -mlvV个ps -ef | grep java 效果是差不多的,打印了大部分的数据,jps -l是经常用的,以为jps -l会打印类的包名和线程id。

jcmd

doc:

1
2
3
4
5
6
7
8
9
10
11
12
13
14
15
16
C:\Users\Administrator>jcmd -help
Usage: jcmd <pid | main class> <command ...|PerfCounter.print|-f file>
or: jcmd -l
or: jcmd -h

command must be a valid jcmd command for the selected jvm.
Use the command "help" to see which commands are available.
If the pid is 0, commands will be sent to all Java processes.
The main class argument will be used to match (either partially
or fully) the class used to start Java.
If no options are given, lists Java processes (same as -p).

PerfCounter.print display the counters exposed by this process
-f read and execute commands from the file
-l list JVM processes on the local machine
-h this help

查看当前jvm的启动参数:

1
2
3
4
5
6
7
8
9
10
11
12
C:\Users\Administrator>jps
11744 MyTest5
19216
4740 Main
11192 Jps
21176 Launcher
4184 RemoteMavenServer
4536 Launcher

C:\Users\Administrator>jcmd 11744 VM.flags
11744:
-XX:CICompilerCount=4 -XX:InitialHeapSize=268435456 -XX:MaxHeapSize=4273995776 -XX:MaxNewSize=1424490496 -XX:MinHeapDeltaBytes=524288 -XX:NewSize=89128960 -XX:OldSize=179306496 -XX:+UseCompressedClassPointers -XX:+UseCompressedOops -XX:+UseFastUnorderedTimeStamps -XX:-UseLargePagesIndividualAllocation -XX:+UseParallelGC

jcmd help

1
2
3
4
5
6
7
8
9
10
11
12
13
14
15
16
17
18
19
20
21
22
23
24
25
26
27
28
29
30
31
32
33
34
35
C:\Users\Administrator>jps
12048 MyTest5
19216
19620 Launcher
21044 Jps
4740 Main
4184 RemoteMavenServer
4536 Launcher

C:\Users\Administrator>jcmd 12048 help
12048:
The following commands are available:
JFR.stop 【JFR:java fly recoder java飞行记录器】
JFR.start
JFR.dump
JFR.check
VM.native_memory
VM.check_commercial_features
VM.unlock_commercial_features
ManagementAgent.stop
ManagementAgent.start_local
ManagementAgent.start
GC.rotate_log
Thread.print
GC.class_stats
GC.class_histogram
GC.heap_dump
GC.run_finalization
GC.run
VM.uptime
VM.flags
VM.system_properties
VM.command_line
VM.version
help

查看某一个命令有哪些参数:

1
2
3
4
5
6
7
8
9
10
11
12
13
14
15
16
17
18
19
20
21
22
23
24
25
26
C:\Users\Administrator>jps
12048 MyTest5
19216
19620 Launcher
21044 Jps
4740 Main
4184 RemoteMavenServer
4536 Launcher

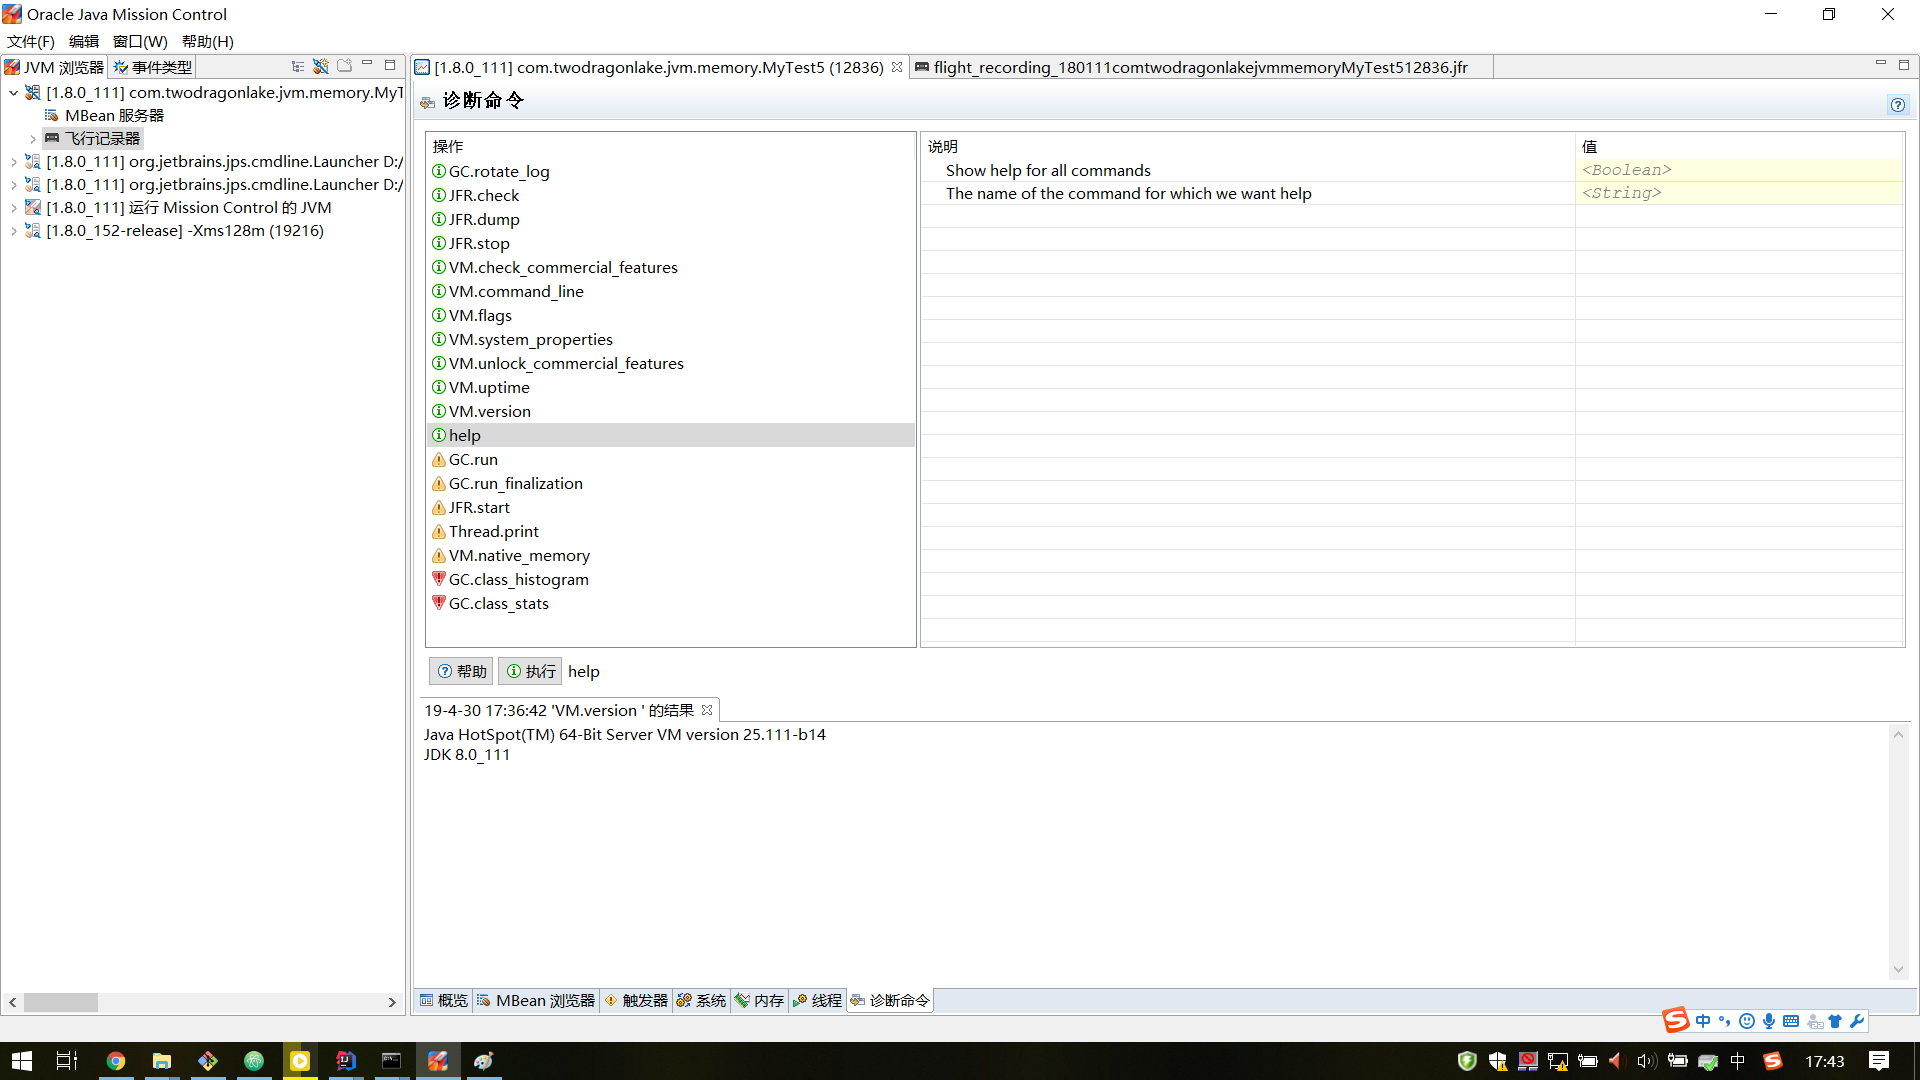
查看JFR.dump有哪些参数:
C:\Users\Administrator>jcmd 12048 help JFR.dump
12048:
JFR.dump
Copies contents of a JFR recording to file. Either the name or the recording id must be specified.

Impact: Low

Permission: java.lang.management.ManagementPermission(monitor)

Syntax : JFR.dump [options]

Options: (options must be specified using the <key> or <key>=<value> syntax)
name : [optional] Recording name, e.g. \"My Recording\" (STRING, no default value)
recording : [optional] Recording number, use JFR.check to list available recordings (JLONG, -1)
filename : Copy recording data to file, i.e \"C:\Users\user\My Recording.jfr\" (STRING, no default value)
compress : [optional] GZip-compress "filename" destination (BOOLEAN, false)

查看当前进程jvm性能相关的参数:

1
2
3
4
5
6
7
8
9
10
11
12
13
14
15
16
17
18
19
20
21
22
23
C:\Users\Administrator>jps
12048 MyTest5
19216
19620 Launcher
21044 Jps
4740 Main
4184 RemoteMavenServer
4536 Launcher

C:\Users\Administrator>jcmd 12048 PerfCounter.print
12048:
java.ci.totalTime=1663910
java.cls.loadedClasses=571
java.cls.sharedLoadedClasses=0
java.cls.sharedUnloadedClasses=0
java.cls.unloadedClasses=0
.... 略 ....
sun.rt.threadInterruptSignaled=0
sun.rt.vmInitDoneTime=1556598418866
sun.threads.vmOperationTime=1543651
sun.urlClassLoader.readClassBytesTime=11464600
sun.zip.zipFile.openTime=7540600
sun.zip.zipFiles=17

jcmd pid VM.uptime 查看当前jvm进程启动时长(启动到现在的时长)。

1
2
3
4
5
6
7
8
9
10
11
12
C:\Users\Administrator>jps
12048 MyTest5
19216
19620 Launcher
21044 Jps
4740 Main
4184 RemoteMavenServer
4536 Launcher

C:\Users\Administrator>jcmd 12048 VM.uptime
12048:
15334.690 s

jcmd 12048 GC.class_histogram 查看系统中类的统计信息。

1
2
3
4
5
6
7
8
9
10
11
12
13
14
15
16
17
18
19
20
C:\Users\Administrator>jps
12048 MyTest5
19216
19620 Launcher
21044 Jps
4740 Main
4184 RemoteMavenServer
4536 Launcher

C:\Users\Administrator>jcmd 12048 GC.class_histogram
12048:

num #instances #bytes class name
----------------------------------------------
1: 2661 362216 [C
2: 653 74544 java.lang.Class
3: 2511 60264 java.lang.String
4: 608 35104 [Ljava.lang.Object;
.....略.....
Total 10031 702888

由于MyTest5是一个死循环,他的类的信息没有变化,如果使用MyTest4(使用osgi动态创建类)那么jcmd pid GC.class_histogram的最后一列
【 Total 10031 702888】会一直变化的。
测试如下:

1
2
3
4
5
6
7
8
9
10
11
12
13
14
15
16
17
18
19
C:\Users\Administrator>jps
19216
7456 Jps
4740 Main
4536 Launcher
872 Launcher
1884 MyTest4

C:\Users\Administrator>jcmd 1884 GC.class_histogram
....略....
Total 802230 39909584
....略....
C:\Users\Administrator>jcmd 1884 GC.class_histogram
....略....
Total 928340 46179936
....略....
C:\Users\Administrator>jcmd 1884 GC.class_histogram
....略....
Total 1066484 53092096

jcmd pid Thread.print打印线程信息

其实在jconsole或者jvisualvm也可以看到。

1
2
3
4
5
6
7
8
9
10
11
12
13
14
15
16
17
18
19
20
21
22
23
24
25
26
27
28
29
30
31
32
33
34
35
36
37
38
39
40
41
42
43
44
45
46
47
48
49
50
51
52
53
54
55
56
57
58
59
60
61
62
63
64
65
66
67
68
69
70
71
72
73
74
75
76
77
78
79
80
81
82
83
84
85
86
87
88
89
90
91
92
93
94
95
96
97
98
99
100
101
102
103
104
105
106
107
108
109
110
111
112
C:\Users\Administrator>jps
1312 Launcher
19216
4740 Main
4536 Launcher
3324 MyTest5
7228 Jps


C:\Users\Administrator>jcmd 3324 Thread.print
3324:
2019-04-30 16:57:16
Full thread dump Java HotSpot(TM) 64-Bit Server VM (25.111-b14 mixed mode):

"Service Thread" #11 daemon prio=9 os_prio=0 tid=0x000000001f080800 nid=0x26e4 runnable [0x0000000000000000]
java.lang.Thread.State: RUNNABLE

"C1 CompilerThread3" #10 daemon prio=9 os_prio=2 tid=0x000000001efd2800 nid=0x1b68 waiting on condition [0x0000000000000000]
java.lang.Thread.State: RUNNABLE

"C2 CompilerThread2" #9 daemon prio=9 os_prio=2 tid=0x000000001efcf800 nid=0x52a4 waiting on condition [0x0000000000000000]
java.lang.Thread.State: RUNNABLE

"C2 CompilerThread1" #8 daemon prio=9 os_prio=2 tid=0x000000001efcd000 nid=0x43f4 waiting on condition [0x0000000000000000]
java.lang.Thread.State: RUNNABLE

"C2 CompilerThread0" #7 daemon prio=9 os_prio=2 tid=0x000000001efc9000 nid=0x36f4 waiting on condition [0x0000000000000000]
java.lang.Thread.State: RUNNABLE

"Monitor Ctrl-Break" #6 daemon prio=5 os_prio=0 tid=0x000000001efc7800 nid=0x4af4 runnable [0x000000001f6ae000]
java.lang.Thread.State: RUNNABLE
at java.net.SocketInputStream.socketRead0(Native Method)
at java.net.SocketInputStream.socketRead(SocketInputStream.java:116)
at java.net.SocketInputStream.read(SocketInputStream.java:170)
at java.net.SocketInputStream.read(SocketInputStream.java:141)
at sun.nio.cs.StreamDecoder.readBytes(StreamDecoder.java:284)
at sun.nio.cs.StreamDecoder.implRead(StreamDecoder.java:326)
at sun.nio.cs.StreamDecoder.read(StreamDecoder.java:178)
- locked <0x00000006c14089e8> (a java.io.InputStreamReader)
at java.io.InputStreamReader.read(InputStreamReader.java:184)
at java.io.BufferedReader.fill(BufferedReader.java:161)
at java.io.BufferedReader.readLine(BufferedReader.java:324)
- locked <0x00000006c14089e8> (a java.io.InputStreamReader)
at java.io.BufferedReader.readLine(BufferedReader.java:389)
at com.intellij.rt.execution.application.AppMainV2$1.run(AppMainV2.java:64)

"Attach Listener" #5 daemon prio=5 os_prio=2 tid=0x000000001ef3d800 nid=0x3180 waiting on condition [0x0000000000000000]
java.lang.Thread.State: RUNNABLE

"Signal Dispatcher" #4 daemon prio=9 os_prio=2 tid=0x000000001eee9000 nid=0x4180 runnable [0x0000000000000000]
java.lang.Thread.State: RUNNABLE

"Finalizer" #3 daemon prio=8 os_prio=1 tid=0x0000000003559800 nid=0x2f04 in Object.wait() [0x000000001f3af000]
java.lang.Thread.State: WAITING (on object monitor)
at java.lang.Object.wait(Native Method)
- waiting on <0x00000006c1406d08> (a java.lang.ref.ReferenceQueue$Lock)
at java.lang.ref.ReferenceQueue.remove(ReferenceQueue.java:143)
- locked <0x00000006c1406d08> (a java.lang.ref.ReferenceQueue$Lock)
at java.lang.ref.ReferenceQueue.remove(ReferenceQueue.java:164)
at java.lang.ref.Finalizer$FinalizerThread.run(Finalizer.java:209)

"Reference Handler" #2 daemon prio=10 os_prio=2 tid=0x0000000003558000 nid=0x3a0 in Object.wait() [0x000000001eeae000]
java.lang.Thread.State: WAITING (on object monitor)
at java.lang.Object.wait(Native Method)
- waiting on <0x00000006c1406d48> (a java.lang.ref.Reference$Lock)
at java.lang.Object.wait(Object.java:502)
at java.lang.ref.Reference.tryHandlePending(Reference.java:191)
- locked <0x00000006c1406d48> (a java.lang.ref.Reference$Lock)
at java.lang.ref.Reference$ReferenceHandler.run(Reference.java:153)

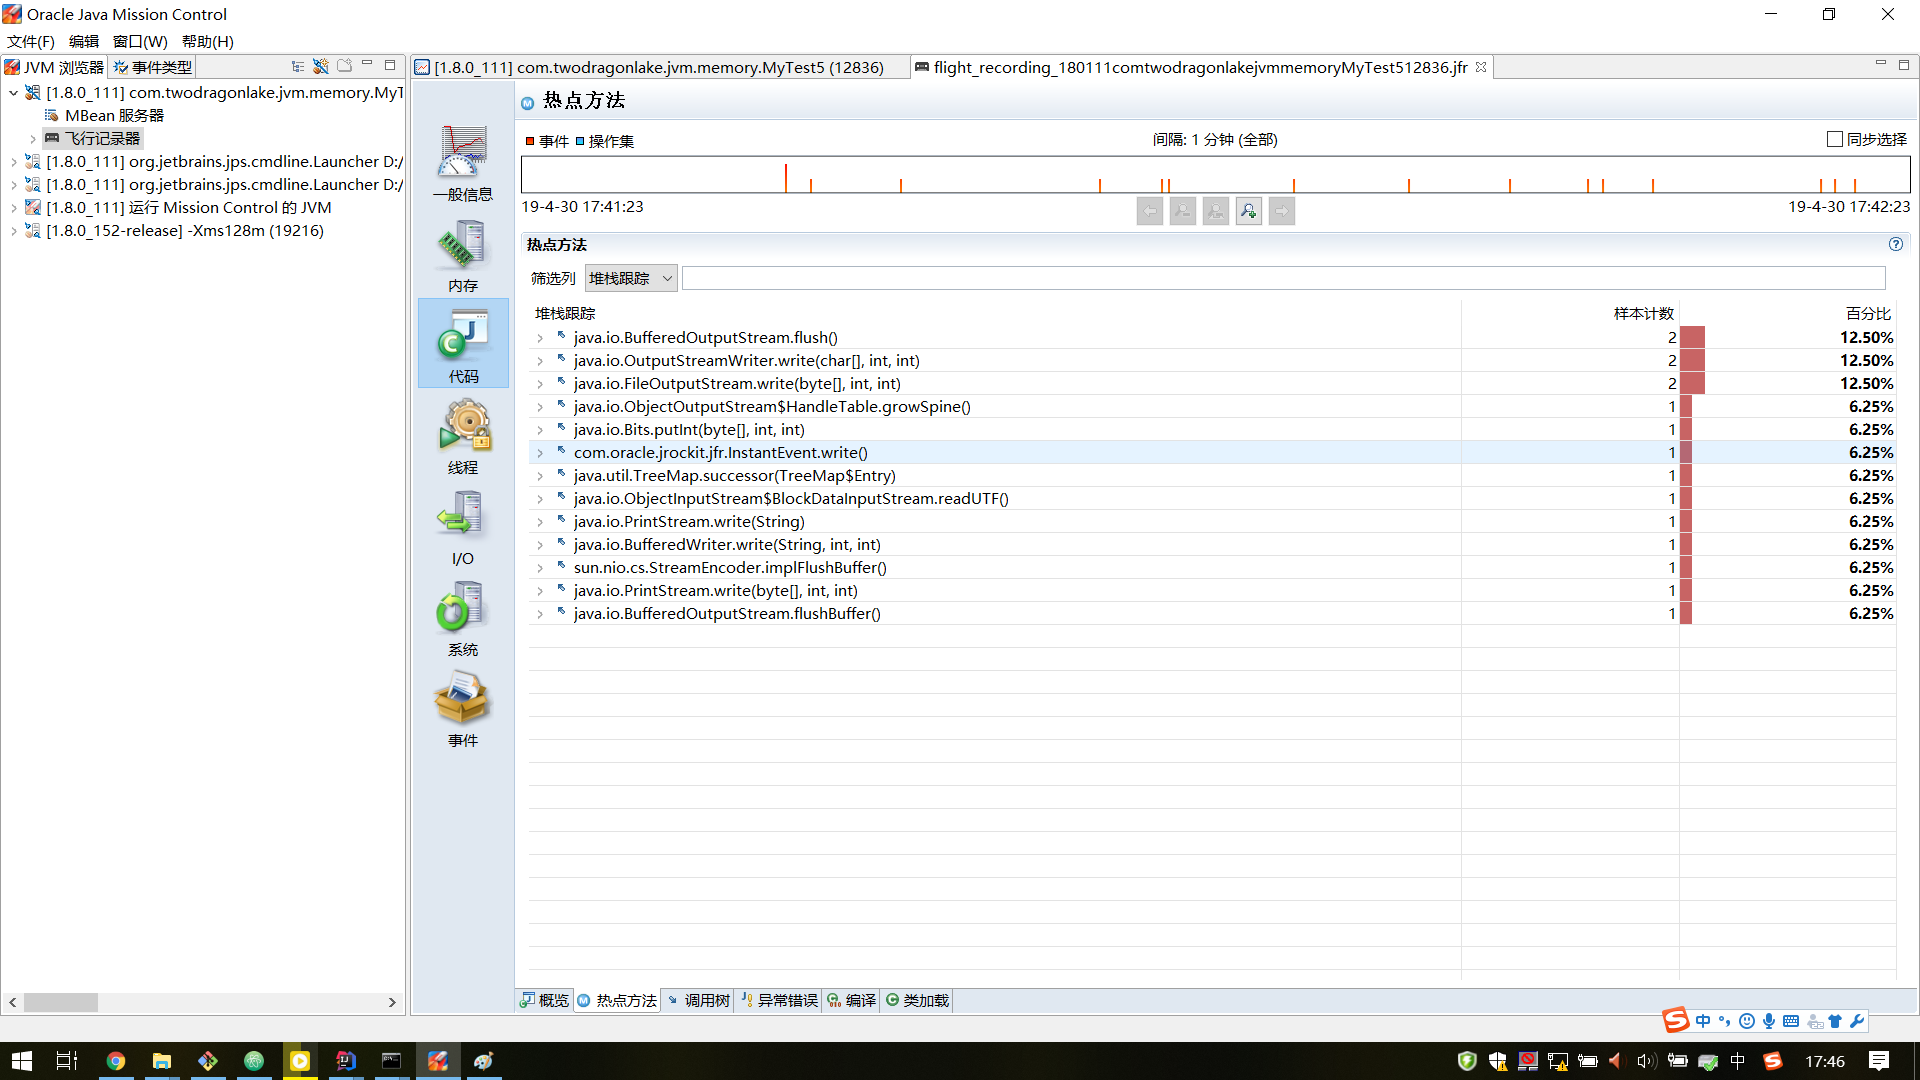
"main" #1 prio=5 os_prio=0 tid=0x0000000003462800 nid=0x28bc runnable [0x000000000328f000]
java.lang.Thread.State: RUNNABLE
at java.io.FileOutputStream.writeBytes(Native Method)
at java.io.FileOutputStream.write(FileOutputStream.java:326)
at java.io.BufferedOutputStream.flushBuffer(BufferedOutputStream.java:82)
at java.io.BufferedOutputStream.flush(BufferedOutputStream.java:140)
- locked <0x00000006c141bf30> (a java.io.BufferedOutputStream)
at java.io.PrintStream.write(PrintStream.java:482)
- locked <0x00000006c140a1e8> (a java.io.PrintStream)
at sun.nio.cs.StreamEncoder.writeBytes(StreamEncoder.java:221)
at sun.nio.cs.StreamEncoder.implFlushBuffer(StreamEncoder.java:291)
at sun.nio.cs.StreamEncoder.flushBuffer(StreamEncoder.java:104)
- locked <0x00000006c140a1a0> (a java.io.OutputStreamWriter)
at java.io.OutputStreamWriter.flushBuffer(OutputStreamWriter.java:185)
at java.io.PrintStream.write(PrintStream.java:527)
- eliminated <0x00000006c140a1e8> (a java.io.PrintStream)
at java.io.PrintStream.print(PrintStream.java:669)
at java.io.PrintStream.println(PrintStream.java:806)
- locked <0x00000006c140a1e8> (a java.io.PrintStream)
at com.twodragonlake.jvm.memory.MyTest5.main(MyTest5.java:34)

"VM Thread" os_prio=2 tid=0x000000001cfb9800 nid=0x2ffc runnable

"GC task thread#0 (ParallelGC)" os_prio=0 tid=0x0000000003478800 nid=0x21b4 runnable

"GC task thread#1 (ParallelGC)" os_prio=0 tid=0x000000000347a000 nid=0x5498 runnable

"GC task thread#2 (ParallelGC)" os_prio=0 tid=0x000000000347b800 nid=0x3928 runnable

"GC task thread#3 (ParallelGC)" os_prio=0 tid=0x000000000347d000 nid=0x2fb8 runnable

"GC task thread#4 (ParallelGC)" os_prio=0 tid=0x0000000003480800 nid=0x2a00 runnable

"GC task thread#5 (ParallelGC)" os_prio=0 tid=0x0000000003481800 nid=0x4678 runnable

"GC task thread#6 (ParallelGC)" os_prio=0 tid=0x0000000003484800 nid=0x3d50 runnable

"GC task thread#7 (ParallelGC)" os_prio=0 tid=0x0000000003486000 nid=0x20b0 runnable

"VM Periodic Task Thread" os_prio=2 tid=0x000000001f0ed800 nid=0x24c0 waiting on condition

JNI global references: 19
jcmd pid Thread.print 检测死锁

【在jconsole或者jvisualvm也可以看到】
运行程序com.twodragonlake.jvm.memory.DeadLock

1
2
3
4
5
6
7
8
9
10
11
12
13
14
15
16
17
18
19
20
21
22
23
24
25
26
27
28
29
30
31
32
33
34
35
36
37
38
39
40
C:\Users\Administrator>jps
19216
4740 Main
21592 Jps
4536 Launcher
14044 DeadLock
14332 Launcher

C:\Users\Administrator>jcmd 14044 Thread.print
14044:
2019-04-30 17:00:02
Full thread dump Java HotSpot(TM) 64-Bit Server VM (25.111-b14 mixed mode):

....略....

【检测到死锁】
Found one Java-level deadlock:
=============================
"thread2":
waiting to lock monitor 0x000000001c6b35f8 (object 0x000000076b345af0, a java.lang.Object),
which is held by "thread1"
"thread1":
waiting to lock monitor 0x000000001e801e68 (object 0x000000076b345b00, a java.lang.Object),
which is held by "thread2"

Java stack information for the threads listed above:
===================================================
"thread2":
at com.twodragonlake.jvm.memory.DeadLock$2.run(DeadLock.java:48)
- waiting to lock <0x000000076b345af0> (a java.lang.Object)
- locked <0x000000076b345b00> (a java.lang.Object)
at java.lang.Thread.run(Thread.java:745)
"thread1":
at com.twodragonlake.jvm.memory.DeadLock$1.run(DeadLock.java:37)
- waiting to lock <0x000000076b345b00> (a java.lang.Object)
- locked <0x000000076b345af0> (a java.lang.Object)
at java.lang.Thread.run(Thread.java:745)

Found 1 deadlock.

查看堆栈信息:

1
2
3
4
5
6
7
8
9
10
11
12
C:\Users\Administrator>jps
19216
19940 Launcher
21700 Jps
4740 Main
3400 MyTest5
4536 Launcher

C:\Users\Administrator>jcmd 3400 GC.heap_dump e:dump.hprof
3400:
Heap dump file created

转储文件可以在jvisualvm里边查看。

jcmd PID VM.system_properties 查看系统属性信息

1
2
3
4
5
6
7
8
9
10
11
12
13
14
15
16
17
18
19
20
21
22
23
24
25
26
27
28
29
30
31
32
33
34
35
36
37
38
39
40
41
42
43
44
45
46
47
48
49
50
51
52
53
54
55
56
57
58
59
60
61
62
63
64
65
C:\Users\Administrator>jps
19216
3776 Jps
19940 Launcher
4740 Main
3400 MyTest5
4536 Launcher

C:\Users\Administrator>jcmd 3400 VM.system_properties
3400:
#Tue Apr 30 17:12:32 CST 2019
java.runtime.name=Java(TM) SE Runtime Environment
sun.boot.library.path=C\:\\Program Files\\Java\\jdk1.8.0_111\\jre\\bin
java.vm.version=25.111-b14
java.vm.vendor=Oracle Corporation
java.vendor.url=http\://java.oracle.com/
path.separator=;
java.vm.name=Java HotSpot(TM) 64-Bit Server VM
file.encoding.pkg=sun.io
user.script=
user.country=CN
sun.java.launcher=SUN_STANDARD
sun.os.patch.level=
java.vm.specification.name=Java Virtual Machine Specification
user.dir=E\:\\Study\\intelIde\\jvm_lecture
java.runtime.version=1.8.0_111-b14
java.awt.graphicsenv=sun.awt.Win32GraphicsEnvironment
java.endorsed.dirs=C\:\\Program Files\\Java\\jdk1.8.0_111\\jre\\lib\\endorsed
os.arch=amd64
java.io.tmpdir=C\:\\Users\\ADMINI~1\\AppData\\Local\\Temp\\
line.separator=\r\n
java.vm.specification.vendor=Oracle Corporation
user.variant=
os.name=Windows 10
sun.jnu.encoding=GBK
java.library.path=C\:\\Program Files\\Java\\jdk1.8.0_111\\bin;C\:\\WINDOWS\\Sun\\Java\\bin;C\:\\WINDOWS\\system32;C\:\\WINDOWS;C\:\\ProgramData\\DockerDesktop\\version-bin;C\:\\Program Files\\Docker\\Docker\\Resources\\bin;D\:\\Python\\Scripts\\;D\:\\Python\\;C\:\\ProgramData\\Oracle\\Java\\javapath;D\:\\SecureCRT\\;D\:\\apache-maven-3.3.9\\bin;C\:\\Program Files\\Java\\jdk1.8.0_111\\bin;C\:\\Program Files\\Java\\jdk1.8.0_111\\jre\\bin;D\:\\RationalRose2007\\common;C\:\\windows\\system32\\;D\:\\UltraEdit;D\:\\firefox;C\:\\WINDOWS\\system32;C\:\\WINDOWS;C\:\\WINDOWS\\System32\\Wbem;C\:\\WINDOWS\\System32\\WindowsPowerShell\\v1.0\\;D\:\\Source Program\\gradle-3.2.1-bin\\gradle-3.2.1\\bin;D\:\\Anaconda;D\:\\Anaconda\\Scripts;D\:\\Anaconda\\Library\\bin;D\:\\Source Program\\nexus-2.14.3-02-bundle\\nexus-2.14.3-02\\bin\\jsw\\windows-x86-64;D\:\\protoc-3.3.0\\bin;D\:\\thrift0.10.0;D\:\\Git\\cmd;D\:\\nodejs\\;D\:\\kotlinc\\bin;C\:\\WINDOWS\\System32\\OpenSSH\\;D\:\\geth;D\:\\blockchain\\web3j-3.4.0\\bin;D\:\\Ruby22-x64\\bin;C\:\\Users\\Administrator\\AppData\\Local\\Microsoft\\WindowsApps;C\:\\Users\\Administrator\\AppData\\Local\\atom\\bin;C\:\\Users\\Administrator\\AppData\\Roaming\\npm;C\:\\Users\\Administrator\\AppData\\Local\\Microsoft\\WindowsApps;D\:\\Microsoft VS Code\\bin;.
java.specification.name=Java Platform API Specification
java.class.version=52.0
sun.management.compiler=HotSpot 64-Bit Tiered Compilers
os.version=10.0
user.home=C\:\\Users\\Administrator
user.timezone=
java.awt.printerjob=sun.awt.windows.WPrinterJob
file.encoding=UTF-8
java.specification.version=1.8
java.class.path=C\:\\Program Files\\Java\\jdk1.8.0_111\\jre\\lib\\charsets.jar;C\:\\Program Files\\Java\\jdk1.8.0_111\\jre\\lib\\deploy.jar;C\:\\Program Files\\Java\\jdk1.8.0_111\\jre\\lib\\ext\\access-bridge-64.jar;C\:\\Program Files\\Java\\jdk1.8.0_111\\jre\\lib\\ext\\cldrdata.jar;C\:\\Program Files\\Java\\jdk1.8.0_111\\jre\\lib\\ext\\dnsns.jar;C\:\\Program Files\\Java\\jdk1.8.0_111\\jre\\lib\\ext\\jaccess.jar;C\:\\Program Files\\Java\\jdk1.8.0_111\\jre\\lib\\ext\\jfxrt.jar;C\:\\Program Files\\Java\\jdk1.8.0_111\\jre\\lib\\ext\\localedata.jar;C\:\\Program Files\\Java\\jdk1.8.0_111\\jre\\lib\\ext\\nashorn.jar;C\:\\Program Files\\Java\\jdk1.8.0_111\\jre\\lib\\ext\\sunec.jar;C\:\\Program Files\\Java\\jdk1.8.0_111\\jre\\lib\\ext\\sunjce_provider.jar;C\:\\Program Files\\Java\\jdk1.8.0_111\\jre\\lib\\ext\\sunmscapi.jar;C\:\\Program Files\\Java\\jdk1.8.0_111\\jre\\lib\\ext\\sunpkcs11.jar;C\:\\Program Files\\Java\\jdk1.8.0_111\\jre\\lib\\ext\\zipfs.jar;C\:\\Program Files\\Java\\jdk1.8.0_111\\jre\\lib\\javaws.jar;C\:\\Program Files\\Java\\jdk1.8.0_111\\jre\\lib\\jce.jar;C\:\\Program Files\\Java\\jdk1.8.0_111\\jre\\lib\\jfr.jar;C\:\\Program Files\\Java\\jdk1.8.0_111\\jre\\lib\\jfxswt.jar;C\:\\Program Files\\Java\\jdk1.8.0_111\\jre\\lib\\jsse.jar;C\:\\Program Files\\Java\\jdk1.8.0_111\\jre\\lib\\management-agent.jar;C\:\\Program Files\\Java\\jdk1.8.0_111\\jre\\lib\\plugin.jar;C\:\\Program Files\\Java\\jdk1.8.0_111\\jre\\lib\\resources.jar;C\:\\Program Files\\Java\\jdk1.8.0_111\\jre\\lib\\rt.jar;E\:\\Study\\intelIde\\jvm_lecture\\out\\production\\classes;D\:\\gradlerepo\\caches\\modules-2\\files-2.1\\mysql\\mysql-connector-java\\5.1.34\\46deba4adbdb4967367b013cbc67b7f7373da60a\\mysql-connector-java-5.1.34.jar;D\:\\gradlerepo\\caches\\modules-2\\files-2.1\\cglib\\cglib\\3.2.8\\331c90f8cd3be5b2ee225354bed68862ba0fd3c8\\cglib-3.2.8.jar;D\:\\gradlerepo\\caches\\modules-2\\files-2.1\\org.ow2.asm\\asm\\6.2.1\\c01b6798f81b0fc2c5faa70cbe468c275d4b50c7\\asm-6.2.1.jar;D\:\\gradlerepo\\caches\\modules-2\\files-2.1\\org.apache.ant\\ant\\1.10.3\\88becdeb77cdd2457757b7268e1a10666c03d382\\ant-1.10.3.jar;D\:\\gradlerepo\\caches\\modules-2\\files-2.1\\org.apache.ant\\ant-launcher\\1.10.3\\9dd5189e7f561ca19833b4e3672720b9bc5cb2fe\\ant-launcher-1.10.3.jar;D\:\\IntelliJ IDEA 2018.2.4\\lib\\idea_rt.jar
user.name=Administrator
java.vm.specification.version=1.8
sun.java.command=com.twodragonlake.jvm.memory.MyTest5
java.home=C\:\\Program Files\\Java\\jdk1.8.0_111\\jre
sun.arch.data.model=64
user.language=zh
java.specification.vendor=Oracle Corporation
awt.toolkit=sun.awt.windows.WToolkit
java.vm.info=mixed mode
java.version=1.8.0_111
java.ext.dirs=C\:\\Program Files\\Java\\jdk1.8.0_111\\jre\\lib\\ext;C\:\\WINDOWS\\Sun\\Java\\lib\\ext
sun.boot.class.path=C\:\\Program Files\\Java\\jdk1.8.0_111\\jre\\lib\\resources.jar;C\:\\Program Files\\Java\\jdk1.8.0_111\\jre\\lib\\rt.jar;C\:\\Program Files\\Java\\jdk1.8.0_111\\jre\\lib\\sunrsasign.jar;C\:\\Program Files\\Java\\jdk1.8.0_111\\jre\\lib\\jsse.jar;C\:\\Program Files\\Java\\jdk1.8.0_111\\jre\\lib\\jce.jar;C\:\\Program Files\\Java\\jdk1.8.0_111\\jre\\lib\\charsets.jar;C\:\\Program Files\\Java\\jdk1.8.0_111\\jre\\lib\\jfr.jar;C\:\\Program Files\\Java\\jdk1.8.0_111\\jre\\classes
java.vendor=Oracle Corporation
file.separator=\\
java.vendor.url.bug=http\://bugreport.sun.com/bugreport/
sun.io.unicode.encoding=UnicodeLittle
sun.cpu.endian=little
sun.desktop=windows
sun.cpu.isalist=amd64

查看jvm运行的版本信息:jcmd PID VM.version

1
2
3
4
5
6
7
8
9
10
11
12
C:\Users\Administrator>jps
19216
19940 Launcher
4740 Main
19688 Jps
3400 MyTest5
4536 Launcher

C:\Users\Administrator>jcmd 3400 VM.version
3400:
Java HotSpot(TM) 64-Bit Server VM version 25.111-b14
JDK 8.0_111

jcmd pid VM.command_line 查看jvm启动命令行参数信息

1
2
3
4
5
6
7
8
9
10
11
12
13
14
15
16
C:\Users\Administrator>jps
19216
19940 Launcher
4740 Main
19688 Jps
3400 MyTest5
4536 Launcher

C:\Users\Administrator>jcmd 3400 VM.command_line
3400:
VM Arguments:
jvm_args: -javaagent:D:\IntelliJ IDEA 2018.2.4\lib\idea_rt.jar=13535:D:\IntelliJ IDEA 2018.2.4\bin -Dfile.encoding=UTF-8
java_command: com.twodragonlake.jvm.memory.MyTest5
java_class_path (initial): C:\Program Files\Java\jdk1.8.0_111\jre\lib\charsets.jar;C:\Program Files\Java\jdk1.8.0_111\jre\lib\deploy.jar;C:\Program Files\Java\jdk1.8.0_111\jre\lib\ext\access-bridge-64.jar;C:\Program Files\Java\jdk1.8.0_111\jre\lib\ext\cldrdata.jar;C:\Program Files\Java\jdk1.8.0_111\jre\lib\ext\dnsns.jar;C:\Program Files\Java\jdk1.8.0_111\jre\lib\ext\jaccess.jar;C:\Program Files\Java\jdk1.8.0_111\jre\lib\ext\jfxrt.jar;C:\Program Files\Java\jdk1.8.0_111\jre\lib\ext\localedata.jar;C:\Program Files\Java\jdk1.8.0_111\jre\lib\ext\nashorn.jar;C:\Program Files\Java\jdk1.8.0_111\jre\lib\ext\sunec.jar;C:\Program Files\Java\jdk1.8.0_111\jre\lib\ext\sunjce_provider.jar;C:\Program Files\Java\jdk1.8.0_111\jre\lib\ext\sunmscapi.jar;C:\Program Files\Java\jdk1.8.0_111\jre\lib\ext\sunpkcs11.jar;C:\Program Files\Java\jdk1.8.0_111\jre\lib\ext\zipfs.jar;C:\Program Files\Java\jdk1.8.0_111\jre\lib\javaws.jar;C:\Program Files\Java\jdk1.8.0_111\jre\lib\jce.jar;C:\Program Files\Java\jdk1.8.0_111\jre\lib\jfr.jar;C:\Program Files\Java\jdk1.8.0_111\jre\lib\jfxswt.jar;C:\Program Files\Java\jdk1.8.0_111\jre\lib\jsse.jar;C:\Program Files\Java\jdk1.8.0_111\jre\lib\management-agent.jar;C:\Program Files\Java\jdk1.8.0_111\jre\lib\plugin.jar;C:\Program Files\Java\jdk1.8.0_111\jre\lib\resources.jar;C:\Program Files\Java\jdk1.8.0_111\jre\lib\rt.jar;E:\Study\intelIde\jvm_lecture\out\production\classes;D:\gradlerepo\caches\modules-2\files-2.1\mysql\mysql-connector-java\5.1.34\46deba4adbdb4967367b013cbc67b7f7373da60a\mysql-connector-java-5.1.34.jar;D:\gradlerepo\caches\modules-2\files-2.1\cglib\cglib\3.2.8\331c90f8cd3be5b2ee225354bed68862ba0fd3c8\cglib-3.2.8.jar;D:\gradlerepo\caches\modules-2\files-2.1\org.ow2.asm\asm\6.2.1\c01b6798f81b0fc2c5faa70cbe468c275d4b50c7\asm-6.2.1.jar;D:\gradlerepo\caches\modules-2\files-2.1\org.apache.ant\ant\1.10.3\88becdeb77cdd2457757b7268e1a10666c03d382\ant-1.10.3.jar;D:\gradlerepo\caches\modules-2\files-2.1\org.apache.ant\ant-launcher\1.10.3\9dd5189e7f561ca
Launcher Type: SUN_STANDARD

jstack 专门用来查看或者导出java线程堆栈的信息

用jstack检测死锁

运行程序com.twodragonlake.jvm.memory.DeadLock

1
2
3
4
5
6
7
8
9
10
11
12
13
14
15
16
17
18
19
20
21
22
23
24
25
26
27
28
29
30
31
32
33
34
35
36
37
38
C:\Users\Administrator>jps
1280 Jps
19216
10900 DeadLock
4740 Main
16840 Launcher
4536 Launcher

C:\Users\Administrator>jstack 10900
2019-04-30 17:26:40
Full thread dump Java HotSpot(TM) 64-Bit Server VM (25.111-b14 mixed mode):

.... 略 ....
【检测到死锁】
Found one Java-level deadlock:
=============================
"thread2":
waiting to lock monitor 0x000000001ef45148 (object 0x000000076b345af0, a java.lang.Object),
which is held by "thread1"
"thread1":
waiting to lock monitor 0x000000001cdb34b8 (object 0x000000076b345b00, a java.lang.Object),
which is held by "thread2"

Java stack information for the threads listed above:
===================================================
"thread2":
at com.twodragonlake.jvm.memory.DeadLock$2.run(DeadLock.java:48)
- waiting to lock <0x000000076b345af0> (a java.lang.Object)
- locked <0x000000076b345b00> (a java.lang.Object)
at java.lang.Thread.run(Thread.java:745)
"thread1":
at com.twodragonlake.jvm.memory.DeadLock$1.run(DeadLock.java:37)
- waiting to lock <0x000000076b345b00> (a java.lang.Object)
- locked <0x000000076b345af0> (a java.lang.Object)
at java.lang.Thread.run(Thread.java:745)

Found 1 deadlock.

jmc(Java Mission control)图形化展示

执行jmc,左侧选择MyTest5的MBean服务器。右侧展示:
jmc1
左侧选择飞行记录器,右侧展示:
jmc2
jmc相比局isualvm和jconsole具有展示更多的系统信息,更加丰富。

我们运行MyTest4的程序(不断创建class的程序),然后使用jmc观察meatspace的变化:
jmc3
meatspace是一直在攀升的,当到达-XX:MaxMetaspaceSize=200m设置的200m时,变化也就会停止。

jhat 对转储文件进行展示分析

1
2
3
4
5
6
7
8
9
10
11

C:\Users\Administrator>jhat e:dump.hprof
Reading from e:dump.hprof...
Dump file created Tue Apr 30 11:41:21 CST 2019
Snapshot read, resolving...
Resolving 257676 objects...
Chasing references, expect 51 dots...................................................
Eliminating duplicate references...................................................
Snapshot resolved.
Started HTTP server on port 7000
Server is ready.

jhat启动了一个server,端口是7000,因此我们打开浏览器就能对齐进行访问看到我们要的结果。
打开http://127.0.0.1:7000/ ,单击【class com.twodragonlake.jvm.memory.MyTest5下边的信息 】就可以打开MyTest5下边的信息
【Execute Object Query Language (OQL) query】可以使用OQL查询各种类或者对象的信息,比如【 select s from java.lang.String s where s.value.length >= 100】